Fundamental Analysis is very important. If you are trading and investing then a time will come when you will have to start taking fundamental analysis seriously. Fundamentals are very important for the markets. Fundamental analysis helps you in finding those companies that are expected to perform better than the market based on the study of its financial performance, strategic position and future plans. Fundamentals rules and the markets and ultimately it is the fundamentals that rule the markets in the long run. However, in the short run, market is rules by sentiments but sentiments are soon overcome by the fundamentals. There are two methods to analyze the markets. One is by looking at the charts and looking for certain price patterns that can predict the near short term future. The other method is by reading the financial statements of a company and looking for things that can tell you about the health of the company. Did you read the post how I made $500K with machine learning and high frequency trading?
Learning how to correctly analyze the markets requires lots of study and hard work. Most of the time this is done by the analysts employed by big Wall Street firms. Their sole job is to study the financial statements all days and look for something that can be used in making the right investment decisions. When you are trading stocks, you need to analyze financial statements of many stocks that number can run into thousands. If you are an amateur stock trader, you can buy professional recommendations by these companies which can be expensive. The purpose of this post is to make you an expert at doing your fundamental analysis and then using robust statistical methods that can help you convert your fundamental analysis into a statistically testable hypothesis.
There are many types of investments available to the investors that includes bonds, stocks, real estate, currencies, commodities, derivatives, pieces of art etc. As said in this post we will focus on how to do fundamental analysis for equities. When you invest in equities you need to method that can give you a list of shares that have the potential of performing better than the market. Once you have a list of shares that have the potential of better performance, you can shortlist shares to invest. One of the famous fundamental analysts is Warren Buffet. So you can well imagine the power of doing fundamental analysis. When we do fundamental analysis, we focus on the firm and try it figure out its real worth which we call the intrinsic value. As said above, we focus on the firms financial performance, its market position and the strategic vision of the management. This can give you an idea what can be the long term value of the firm which we call the intrinsic value as said.
For example a pharmaceutical firm is engaged in a ground breaking research on a cancer drug. The research has been promising and the firm is near developing the cancer cure. When this news hits the market, this can propel its share price higher. So investing in the firm before time can help you reap the profit. As said above, finding the right stock for investment, you will first have to analyze thousands of stocks. After analyzing thousands of stocks, you can finally discover a few stocks that can give you good return. Analyzing thousands of stocks is a daunting task. You will need to develop a spreadsheet that records the name of the company and do an in depth analysis of its future financial performance. Doing the financial modelling on Excel can be time consuming.
Collecting Stock Market Data
R is a powerful statistical and machine learning language that can help you a lot in analyzing thousands of stocks in just a few minutes. You just need to develop a robust model. After developing a robust statistical model, you can use it over and over again to analyze thousands and thousand of stocks. This is precisely what we will be doing in this post. The key is to develop a robust statistical model that can identify shares that are mispriced. Finding undervalued stocks will give you good opportunities to go long. Finding overvalued stocks will give you good opportunities to go short. In this post we will focus on finding undervalued stocks. We will build statistical models that can help us identify undervalued stocks. We need a model that can look at the fundamental characteristics of the firm that predicted its share price increase in the next 12 months. We don’t need any insider information. We will be only using publicly available information and develop a robust statistical model that can look at a firm and predict the performance of its share in the next 12 months. So this is what we will be doing.
- Collecting financial statements. This will be done using the power of R. R will help us fetch the required financial statements online. If you use Excel this can be a time consuming and daunting task. Using R will make it a breeze.
- Calculate the fundamental ratios for each firm and standardize the data so that we can compare the firms to one another. Again R will help us in making the task easy with a few commands
- Finding the link between these standardized ratios and future share price.
If you are a professional trader you will need to use Bloomberg Terminal to download the required fundamental data for each firm. But you will have to pay a fee for Bloomberg Terminal which can be expensive. Here R comes to our help. With Quantmod package we can download Balance Sheet, Income Statement and the Cash Flow Statement from Google Finance.
> #load quanmod > library("quantmod") > # Import the csv file > AAPL <- getFinancials('AAPL') > # 'BS' for balance sheet, 'IS' for income statement, 'CF' for cash flow statement > # 'A' for annual, 'Q' for quarterly > #download Apple Income Statement last three quarters > AAPL.f$IS$Q 2017-04-01 2016-12-31 2016-09-24 Revenue 52896.00 78351.00 46852.00 Other Revenue, Total NA NA NA Total Revenue 52896.00 78351.00 46852.00 Cost of Revenue, Total 32305.00 48175.00 29039.00 Gross Profit 20591.00 30176.00 17813.00 Selling/General/Admin. Expenses, Total 3718.00 3946.00 3482.00 Research & Development 2776.00 2871.00 2570.00 Depreciation/Amortization NA NA NA Interest Expense(Income) - Net Operating NA NA NA Unusual Expense (Income) NA NA NA Other Operating Expenses, Total NA NA NA Total Operating Expense 38799.00 54992.00 35091.00 Operating Income 14097.00 23359.00 11761.00 Interest Income(Expense), Net Non-Operating NA NA NA Gain (Loss) on Sale of Assets NA NA NA Other, Net -165.00 122.00 -159.00 Income Before Tax 14684.00 24180.00 12188.00 Income After Tax 11029.00 17891.00 9014.00 Minority Interest NA NA NA Equity In Affiliates NA NA NA Net Income Before Extra. Items 11029.00 17891.00 9014.00 Accounting Change NA NA NA Discontinued Operations NA NA NA Extraordinary Item NA NA NA Net Income 11029.00 17891.00 9014.00 Preferred Dividends NA NA NA Income Available to Common Excl. Extra Items 11029.00 17891.00 9014.00 Income Available to Common Incl. Extra Items 11029.00 17891.00 9014.00 Basic Weighted Average Shares NA NA NA Basic EPS Excluding Extraordinary Items NA NA NA Basic EPS Including Extraordinary Items NA NA NA Dilution Adjustment NA NA NA Diluted Weighted Average Shares 5261.69 5327.99 5393.33 Diluted EPS Excluding Extraordinary Items 2.10 3.36 1.67 Diluted EPS Including Extraordinary Items NA NA NA Dividends per Share - Common Stock Primary Issue 0.57 0.57 0.57 Gross Dividends - Common Stock NA NA NA Net Income after Stock Based Comp. Expense NA NA NA Basic EPS after Stock Based Comp. Expense NA NA NA Diluted EPS after Stock Based Comp. Expense NA NA NA Depreciation, Supplemental NA NA NA Total Special Items NA NA NA Normalized Income Before Taxes NA NA NA Effect of Special Items on Income Taxes NA NA NA Income Taxes Ex. Impact of Special Items NA NA NA Normalized Income After Taxes NA NA NA Normalized Income Avail to Common NA NA NA Basic Normalized EPS NA NA NA Diluted Normalized EPS 2.10 3.36 1.67 2016-06-25 2016-03-26 Revenue 42358.00 50557.00 Other Revenue, Total NA NA Total Revenue 42358.00 50557.00 Cost of Revenue, Total 26252.00 30636.00 Gross Profit 16106.00 19921.00 Selling/General/Admin. Expenses, Total 3441.00 3423.00 Research & Development 2560.00 2511.00 Depreciation/Amortization NA NA Interest Expense(Income) - Net Operating NA NA Unusual Expense (Income) NA NA Other Operating Expenses, Total NA NA Total Operating Expense 32253.00 36570.00 Operating Income 10105.00 13987.00 Interest Income(Expense), Net Non-Operating NA NA Gain (Loss) on Sale of Assets NA NA Other, Net -263.00 -510.00 Income Before Tax 10469.00 14142.00 Income After Tax 7796.00 10516.00 Minority Interest NA NA Equity In Affiliates NA NA Net Income Before Extra. Items 7796.00 10516.00 Accounting Change NA NA Discontinued Operations NA NA Extraordinary Item NA NA Net Income 7796.00 10516.00 Preferred Dividends NA NA Income Available to Common Excl. Extra Items 7796.00 10516.00 Income Available to Common Incl. Extra Items 7796.00 10516.00 Basic Weighted Average Shares NA NA Basic EPS Excluding Extraordinary Items NA NA Basic EPS Including Extraordinary Items NA NA Dilution Adjustment NA NA Diluted Weighted Average Shares 5472.78 5540.89 Diluted EPS Excluding Extraordinary Items 1.42 1.90 Diluted EPS Including Extraordinary Items NA NA Dividends per Share - Common Stock Primary Issue 0.57 0.52 Gross Dividends - Common Stock NA NA Net Income after Stock Based Comp. Expense NA NA Basic EPS after Stock Based Comp. Expense NA NA Diluted EPS after Stock Based Comp. Expense NA NA Depreciation, Supplemental NA NA Total Special Items NA NA Normalized Income Before Taxes NA NA Effect of Special Items on Income Taxes NA NA Income Taxes Ex. Impact of Special Items NA NA Normalized Income After Taxes NA NA Normalized Income Avail to Common NA NA Basic Normalized EPS NA NA Diluted Normalized EPS 1.42 1.90 attr(,"col_desc") [1] "13 weeks ending 2017-04-01" "14 weeks ending 2016-12-31" [3] "13 weeks ending 2016-09-24" "13 weeks ending 2016-06-25" [5] "13 weeks ending 2016-03-26" > #download Apple Balance Sheet Annual > AAPL.f$BS$A 2016-09-24 2015-09-26 2014-09-27 Cash & Equivalents NA NA NA Short Term Investments 58554.00 30212.00 14845.00 Cash and Short Term Investments 67155.00 41601.00 25077.00 Accounts Receivable - Trade, Net 15754.00 16849.00 17460.00 Receivables - Other NA NA NA Total Receivables, Net 29299.00 30343.00 27219.00 Total Inventory 2132.00 2349.00 2111.00 Prepaid Expenses NA NA NA Other Current Assets, Total 8283.00 15085.00 14124.00 Total Current Assets 106869.00 89378.00 68531.00 Property/Plant/Equipment, Total - Gross 61245.00 49257.00 39015.00 Accumulated Depreciation, Total -34235.00 -26786.00 -18391.00 Goodwill, Net 5414.00 5116.00 4616.00 Intangibles, Net 3206.00 3893.00 4142.00 Long Term Investments 170430.00 164065.00 130162.00 Other Long Term Assets, Total 8757.00 5422.00 3764.00 Total Assets 321686.00 290345.00 231839.00 Accounts Payable 37294.00 35490.00 30196.00 Accrued Expenses 20951.00 24169.00 7689.00 Notes Payable/Short Term Debt 8105.00 8499.00 6308.00 Current Port. of LT Debt/Capital Leases 3500.00 2500.00 NA Other Current liabilities, Total 9156.00 9952.00 19255.00 Total Current Liabilities 79006.00 80610.00 63448.00 Long Term Debt 75427.00 53329.00 28987.00 Capital Lease Obligations NA NA NA Total Long Term Debt 75427.00 53329.00 28987.00 Total Debt 87032.00 64328.00 35295.00 Deferred Income Tax 26019.00 24062.00 20259.00 Minority Interest NA NA NA Other Liabilities, Total 12985.00 12989.00 7598.00 Total Liabilities 193437.00 170990.00 120292.00 Redeemable Preferred Stock, Total NA NA NA Preferred Stock - Non Redeemable, Net NA NA NA Common Stock, Total 31251.00 27416.00 23313.00 Additional Paid-In Capital NA NA NA Retained Earnings (Accumulated Deficit) 96364.00 92284.00 87152.00 Treasury Stock - Common NA NA NA Other Equity, Total 596.00 -1117.00 -282.00 Total Equity 128249.00 119355.00 111547.00 Total Liabilities & Shareholders' Equity 321686.00 290345.00 231839.00 Shares Outs - Common Stock Primary Issue NA NA NA Total Common Shares Outstanding 5336.17 5578.75 5866.16 2013-09-28 Cash & Equivalents NA Short Term Investments 31841.00 Cash and Short Term Investments 40546.00 Accounts Receivable - Trade, Net 13102.00 Receivables - Other NA Total Receivables, Net 20641.00 Total Inventory 1764.00 Prepaid Expenses NA Other Current Assets, Total 10335.00 Total Current Assets 73286.00 Property/Plant/Equipment, Total - Gross 28519.00 Accumulated Depreciation, Total -11922.00 Goodwill, Net 1577.00 Intangibles, Net 4179.00 Long Term Investments 106215.00 Other Long Term Assets, Total 5146.00 Total Assets 207000.00 Accounts Payable 22367.00 Accrued Expenses 4782.00 Notes Payable/Short Term Debt 0.00 Current Port. of LT Debt/Capital Leases NA Other Current liabilities, Total 16509.00 Total Current Liabilities 43658.00 Long Term Debt 16960.00 Capital Lease Obligations NA Total Long Term Debt 16960.00 Total Debt 16960.00 Deferred Income Tax 16489.00 Minority Interest NA Other Liabilities, Total 6344.00 Total Liabilities 83451.00 Redeemable Preferred Stock, Total NA Preferred Stock - Non Redeemable, Net NA Common Stock, Total 19764.00 Additional Paid-In Capital NA Retained Earnings (Accumulated Deficit) 104256.00 Treasury Stock - Common NA Other Equity, Total -296.00 Total Equity 123549.00 Total Liabilities & Shareholders' Equity 207000.00 Shares Outs - Common Stock Primary Issue NA Total Common Shares Outstanding 6294.37 attr(,"col_desc") [1] "As of 2016-09-24" "As of 2015-09-26" "As of 2014-09-27" "As of 2013-09-28"
You can read the above Income Statement and Balance Sheet of Apple. Did you read the post on how to price stock options using R? This was just one financial statement that I downloaded. R took less than 20 seconds to download and print the full reports. But we need to download thousands of such financial statements. For example if want to download the NASDAQ Composite Index member firms data than I will have to deal with something like 22,000 firms. After that I will have to clean the data and put that in proper format. This is known as data pre-processing. So collecting the data and then doing data pre-processing is a challenging job. Did you read the post on how to develop S&P 500 ARIMA and GARCH Model? R makes it very easy to do many things that would have taken hours if we had build our fundamental analysis model on Excel. Below is the stock symbols from NASDAQ.
> symbolData2 <- stockSymbols(exchange="NASDAQ")
Fetching NASDAQ symbols...
> dim(symbolData2)
[1] 3231    8
> head(symbolData2)
  Symbol                                   Name LastSale MarketCap IPOyear
1   AAAP Advanced Accelerator Applications S.A.    39.88    $1.75B    2015
2   AABA                            Altaba Inc.    57.23   $51.21B      NA
3    AAL          American Airlines Group, Inc.    54.22   $26.71B      NA
4   AAME          Atlantic American Corporation     3.65   $74.51M      NA
5   AAOI          Applied Optoelectronics, Inc.    84.20     $1.6B    2013
6   AAON                             AAON, Inc.    37.50    $1.97B      NA
          Sector                        Industry Exchange
1    Health Care           Major Pharmaceuticals   NASDAQ
2     Technology                    EDP Services   NASDAQ
3 Transportation   Air Freight/Delivery Services   NASDAQ
4        Finance                  Life Insurance   NASDAQ
5     Technology                  Semiconductors   NASDAQ
6  Capital Goods Industrial Machinery/Components   NASDAQ
That were stock symbols from NASDAQ. There are 3231 stock ticker symbols in the above list. You can read the marketcap for each stock plus IPOyear for that stock. Below we download the stock symbols from New York Stock Exchange.
> symbolData3 <- stockSymbols(exchange="NYSE") Fetching NYSE symbols... > dim(symbolData3) [1] 3143 8 > head(symbolData3) Symbol Name LastSale MarketCap IPOyear Sector 1 A Agilent Technologies, Inc. 61.52 $19.77B 1999 Capital Goods 2 AA Alcoa Corporation 36.32 $6.69B 2016 Capital Goods 3 AAC AAC Holdings, Inc. 6.76 $162.73M 2014 Health Care 4 AAN Aaron's, Inc. 37.75 $2.74B NA Technology 5 AAP Advance Auto Parts Inc 102.04 $7.54B NA Consumer Services 6 AAT American Assets Trust, Inc. 39.61 $1.87B 2011 Consumer Services Industry Exchange 1 Biotechnology: Laboratory Analytical Instruments NYSE 2 Metal Fabrications NYSE 3 Medical Specialities NYSE 4 Diversified Commercial Services NYSE 5 Other Specialty Stores NYSE 6 Real Estate Investment Trusts NYSE
There are 3143 stock ticker symbols from the New York Stock Exchange that have been download by R in just 30 seconds. You can also download AMEX stock list using R. The first step is to collect data. We downloaded the financial statements from Google Finance. We will also use Yahoo Finance to download financial data for any stock symbol. We can download the following financial data.
> yahooQF()

 1:   Ask
 2:   Average Daily Volume
 3:   Ask Size
 4:   Bid
 5:   Ask (Real-time)
 6:   Bid (Real-time)
 7:   Book Value
 8:   Bid Size
 9:   Change & Percent Change
10:   Change
11:   Commission
12:   Change (Real-time)
13:   After Hours Change (Real-time)
14:   Dividend/Share
15:   Last Trade Date
16:   Trade Date
17:   Earnings/Share
18:   Error Indication (returned for symbol changed / invalid)
19:   EPS Estimate Current Year
20:   EPS Estimate Next Year
21:   EPS Estimate Next Quarter
22:   Float Shares
23:   Days Low
24:   Days High
25:   52-week Low
26:   52-week High
27:   Holdings Gain Percent
28:   Annualized Gain
29:   Holdings Gain
30:   Holdings Gain Percent (Real-time)
31:   Holdings Gain (Real-time)
32:   More Info
33:   Order Book (Real-time)
34:   Market Capitalization
35:   Market Cap (Real-time)
36:   EBITDA
37:   Change From 52-week Low
38:   Percent Change From 52-week Low
39:   Last Trade (Real-time) With Time
40:   Change Percent (Real-time)
41:   Last Trade Size
42:   Change From 52-week High
43:   Percent Change From 52-week High
44:   Last Trade (With Time)
45:   Last Trade (Price Only)
46:   High Limit
47:   Low Limit
48:   Days Range
49:   Days Range (Real-time)
50:   50-day Moving Average
51:   200-day Moving Average
52:   Change From 200-day Moving Average
53:   Percent Change From 200-day Moving Average
54:   Change From 50-day Moving Average
55:   Percent Change From 50-day Moving Average
56:   Name
57:   Notes
58:   Open
59:   Previous Close
60:   Price Paid
61:   Change in Percent
62:   Price/Sales
63:   Price/Book
64:   Ex-Dividend Date
65:   P/E Ratio
66:   Dividend Pay Date
67:   P/E Ratio (Real-time)
68:   PEG Ratio
69:   Price/EPS Estimate Current Year
70:   Price/EPS Estimate Next Year
71:   Symbol
72:   Shares Owned
73:   Short Ratio
74:   Last Trade Time
75:   Trade Links
76:   Ticker Trend
77:   1 yr Target Price
78:   Volume
79:   Holdings Value
80:   Holdings Value (Real-time)
81:   52-week Range
82:   Days Value Change
83:   Days Value Change (Real-time)
84:   Stock Exchange
85:   Dividend Yield
Enter one or more numbers separated by spaces, or an empty line to cancel
1: 85
[[1]]
[1] "y"

[[2]]
[1] "Dividend Yield"

attr(,"class")
[1] "quoteFormat"
You can see you can download 85 different financial figures for any stock symbol.
> getQuote("AAPL", what = yahooQF(c("Market Capitalization", "Earnings/Share",
+                                 "P/E Ratio", "Book Value", "EBITDA",
+                                 "Price/Book")))
              Trade Time Market Capitalization Earnings/Share P/E Ratio Book Value EBITDA
AAPL 2017-07-14 04:00:00               777.07B           8.52     17.48      25.76 69.72B
     Price/Book
AAPL       5.74
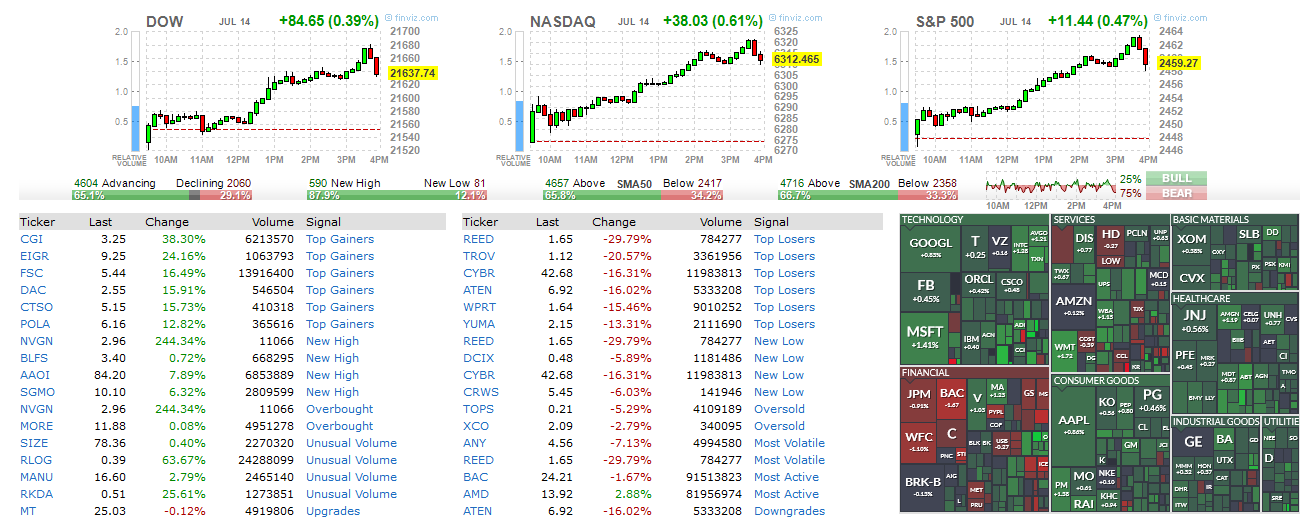
In the above code, we downloaded the Market Capitalization, Earnings/Share, P/E Ratio, Book Value, EBITDA, Price/Book for Apple stock AAPL as off 14th July 2017. We need more information that relates to the financial statements. As said above we will need to build a model, It might take a few days to build the model but once we have it we can use it again and again. Each time it will only take a few minutes to analyze thousands of stocks and shortlist the best stocks for us. We are using the stock market data that is freely available on Google Finance and Yahoo Finance. If you have an Interactive Brokers account, you can download a lot of data for thousands of stocks. Opening an Interactive Brokers account requires an initial deposit of $10K. Similarly you can open an account with Finviz and download data for around 7,000 stocks. By now you should got the main point of fundamental analysis. The whole exercise of fundamental analysis is find the true value of a stock. If the true value of the stock which is also called the intrinsic value is above the market value than we call that stock undervalued. The whole aim of fundamental analysis is to find undervalued stocks. Google had launched a stock screener. You can check it. I have not used it extensively. There are reports it is broken. Ultimately you will need quality stock data if you are a serious investor. You will in the end have to subscribe t a paid service like Bloomberg Terminal, Reuters etc.